
Trucking Cost per Mile Calculator
Every spot market load offer and contract rate is an unverified number until measured against your audited all-mile operating floor. Operating without a documented cost per mile leads to cash insolvency because unloaded deadhead miles, equipment financing, and maintenance reserves consume revenue before owner compensation is funded.
Operating cost per mile
Planning estimate only. Results depend entirely on your inputs and may exclude taxes, financing, downtime, or contract-specific charges.
Driver Compensation Floor
The single largest cost. Hauling under operating cost plus driver pay means working for free.
Dual Saddle Fuel Tanks & DEF
15,385 gallons burned annually. A 0.5 MPG loss drains $4,200 straight from net cash flow.
Sleeper Cab Chassis & Debt Note
A relentless $2,916/month debt clock that never pauses when freight softens or weather strikes.
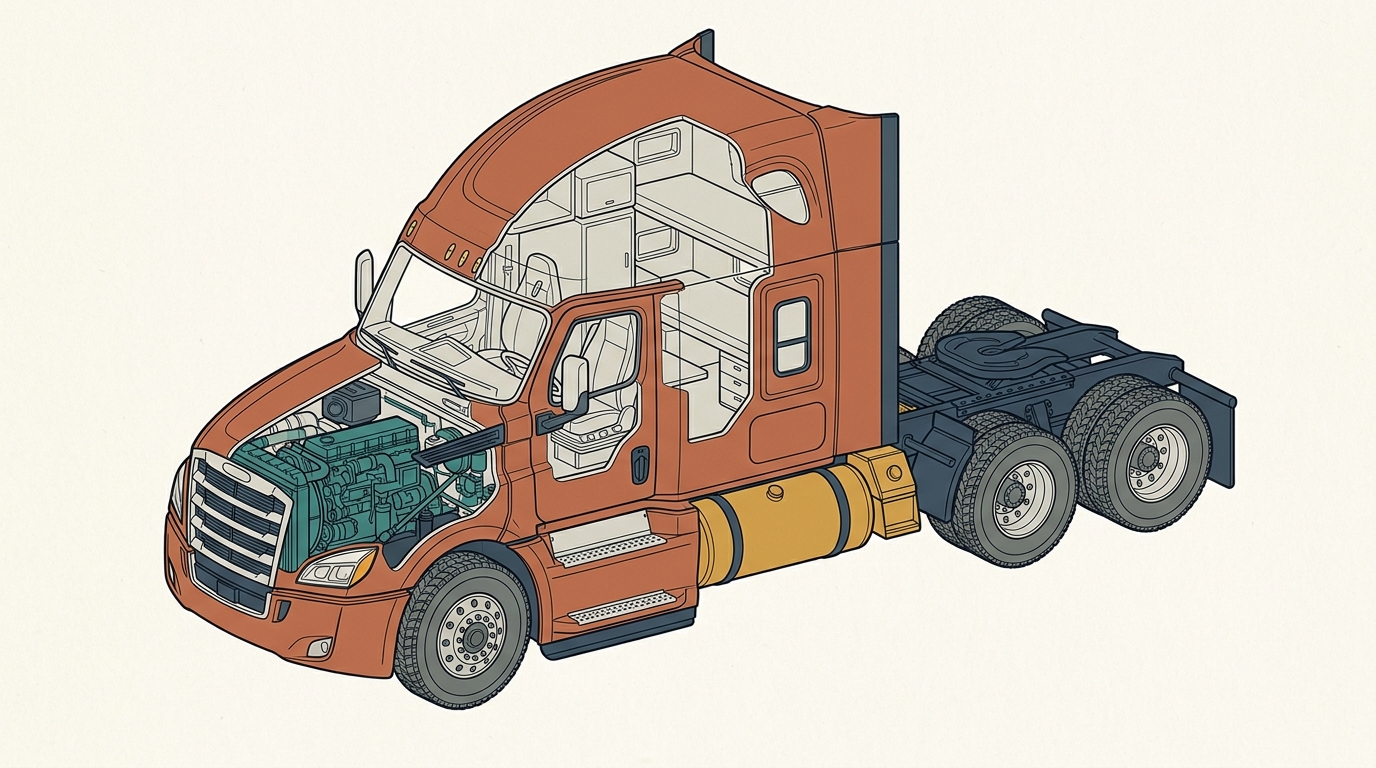
Powertrain & Overhaul Escrow
At $32,000 per engine rebuild, carriers without dedicated escrow fail on their first head gasket.
Regulatory Overhead & Insurance
Commercial liability, ELD subscriptions, IRP plates, and federal compliance mandates.
18-Wheel Tire Tread Lifecycle
10 PSI under-inflation burns 1% extra fuel and destroys tire casings for future retreading.
Driver Compensation Floor
Ongoing weekly owner draw / payroll
Never bid below your personal W-2 wage equivalent. If a load pays less than operating expenses plus $0.78/mi, you are donating your driving labor for free while bearing 100% of the equipment risk.
Complete Class 8 Operating Cost Distribution (ATRI Baseline)
| Expense Category | Classification | Cost / Mile | Annualized (100k mi) | Cost Share | Operating Vulnerability |
|---|---|---|---|---|---|
| Driver Compensation Floor | Driver Pay | $0.78/mi | $78,000 | 33.3% | Ongoing weekly owner draw / payroll |
| Dual Saddle Fuel Tanks & DEF | Fuel & Fluids | $0.55/mi | $55,000 | 23.5% | 15,385 gallons / 100k miles (6.5 MPG baseline) |
| Sleeper Cab Chassis & Debt Note | Equipment Financing | $0.35/mi | $35,000 | 15% | $2,200 – $2,900 / month commercial equipment debt |
| Powertrain & Overhaul Escrow | Maintenance | $0.20/mi | $20,000 | 8.5% | PM every 25,000 mi · In-frame engine rebuild at 600k mi ($28k–$36k) |
| Regulatory Overhead & Insurance | Fixed Overhead | $0.41/mi | $41,000 | 17.5% | ELD monthly subscription + Annual Auto Liability renewal ($14k+) |
| 18-Wheel Tire Tread Lifecycle | Tires | $0.05/mi | $5,000 | 2.1% | Steers: 100k mi · Drives: 250k–350k mi · Trailer: 200k mi |
| TOTAL OPERATING BASELINE FLOOR | $2.34/mi | $234,000 | 100.0% | Minimum survival floor before business net profit | |
Core Operating Findings
National Cost Floor
Average marginal cost per mile for U.S. motor carriers across combined linehaul and regional operations in ATRI benchmark research.
Driver Compensation
Driver wages ($0.65/mi) and benefits ($0.13/mi) combine to form the largest single expense category at $0.780/mile.
Diesel Fuel Baseline
Fuel consumes 23.5% ($0.55/mi) of total revenue based on 6.5 MPG and 100,000 annual operational miles.
A national cost average is a challenge test, not your answer
ATRI’s annual operational cost study synthesizes billions of miles of real carrier telemetry. It is useful for spotting omitted expenses in your own business model, but equipment debt, insurance rates, and regional fuel prices determine your real break-even rate.
Average Cost per Mile
Industry-average marginal cost to operate a Class 8 truck reported in ATRI’s analysis.
Cost Excluding Fuel
Non-fuel operating baseline covering equipment, driver wages, maintenance, and overhead.
Annual Cost Increase
Year-over-year cost inflation driven primarily by equipment payments, parts, and insurance.
If your calculated operating floor sits below $1.90/mile, audit omitted owner compensation, financing debt, tires, maintenance reserves, and unpaid deadhead miles before booking freight.
ATRI Comprehensive Trucking Cost per Mile Benchmark Breakdown (100k Annual Miles)
| Expense Category | Cost / Mile | Annual (100k mi) | % of Operating Cost | Cost Behavior |
|---|---|---|---|---|
| Driver Wages & Benefits | $0.780 | $78,000 | 33.3% | Variable / Operating Burden |
| Diesel Fuel Expense | $0.550 | $55,000 | 23.5% | Variable (Fuel & IFTA) |
| Truck & Trailer Lease / Note | $0.350 | $35,000 | 15.0% | Fixed (Monthly Equipment Note) |
| Overhead & Administration | $0.230 | $23,000 | 9.8% | Fixed / Semi-variable |
| Repair & Maintenance Reserve | $0.200 | $20,000 | 8.5% | Variable (Parts, Tires & Labor) |
| Commercial Truck Insurance | $0.110 | $11,000 | 4.7% | Fixed (Annual Policy Premium) |
| Tolls, Permits & State Licensing | $0.070 | $7,000 | 3.0% | Variable (Route-dependent) |
| Tires & Casing Reserves | $0.050 | $5,000 | 2.1% | Variable (Tire Wear Reserve) |
| Total Industry Benchmark Floor | $2.340 | $234,000 | 100.0% | Total Operating Floor |
Source: Synthesized from ATRI Operational Costs of Trucking research. Individual owner-operator numbers fluctuate with tractor age, interest rates, and lane selection.
How to Calculate Your True Cost per Mile: The Exact Mathematical Formula
Cost per Mile (CPM) is the foundational financial metric of commercial trucking. Formula: Cost per Mile = (Monthly Fixed Overhead ÷ Total Monthly Miles) + Variable Cost per Mile. To calculate your floor accurately, you must track every cash outflow across both categories.
- Step 1: Itemize Monthly Fixed Overhead: Calculate expenses that do not change based on mileage: commercial tractor loan or lease note, trailer financing, primary auto liability and physical damage insurance, ELD software subscriptions, load board fees, business accounting services, physical parking rent, and annual state permits.
- Step 2: Track Total Operational Miles: Record all odometer miles driven during the accounting period: loaded transit miles, empty origin deadhead miles to shippers, and repositioning miles to your next freight market.
- Step 3: Measure Variable Operating Costs: Calculate expenses incurred strictly when wheels are turning: diesel fuel, DEF, routine oil changes and lubrication, tire casing wear, highway and bridge tolls, and driver compensation.
- Step 4: Combine Fixed Dilution and Variable Outflows: Divide total monthly fixed costs by total operational miles, then add your variable per-mile expenses to establish your true all-mile operating floor.
Fixed Cost Allocation: The Mathematical Law of Mileage Dilution
Fixed costs remain completely constant every month whether your tractor runs 11,000 miles across five states or sits parked in a yard for three weeks. Because fixed costs are divided by total operational miles, higher utilization spreads those fixed dollars over more miles, dramatically reducing your fixed cost per mile.
- Low Utilization (5,000 miles/month): With $4,500 in fixed monthly overhead, fixed CPM is $0.90/mile ($4,500 ÷ 5,000). Adding $1.35 in variable expenses creates an unsustainable break-even floor of $2.25/mile.
- Regional Average (7,500 miles/month): Fixed CPM drops to $0.60/mile ($4,500 ÷ 7,500). Combined with variable expenses, the break-even floor falls to $1.95/mile.
- OTR Full Utilization (10,000 miles/month): Fixed CPM is diluted to $0.45/mile ($4,500 ÷ 10,000), reducing the break-even floor to $1.80/mile.
- The False Utilization Trap: Never haul freight below your variable operating cost ($1.35/mi) simply to "put miles on the truck." Hauling below variable cost burns out-of-pocket cash and accelerates equipment depreciation without contributing a penny to fixed debt.
The 2025–2026 ATRI Operational Cost Benchmark Breakdown ($2.336/Mile)
The American Transportation Research Institute (ATRI) annual study synthesizes billions of miles of real-world fleet telemetry to document the industry average marginal cost of operating a Class 8 commercial tractor. In 2025/2026, total average operational costs hit a record $2.336 per mile ($1.854 excluding fuel).
- Driver Labor ($1.028 / mi): Driver wages ($0.818/mi) and employer-provided benefits ($0.210/mi) represent the single largest expense category, comprising 44.0% of total operational cost.
- Diesel Fuel ($0.482 / mi): Fuel represents 20.6% of total operational cost, reflecting an industry average fleet fuel economy of 6.6 MPG across combined terrain.
- Equipment Debt & Payments ($0.404 / mi): Truck and trailer lease or loan payments increased by 3.6% year-over-year, reflecting high post-pandemic equipment capital costs.
- Repair & Maintenance ($0.215 / mi): Shop labor and parts surged 8.6% year-over-year due to aging fleet profiles, expensive emissions sensors, and higher technician labor rates.
- Insurance Premiums ($0.106 / mi): Commercial auto liability and cargo premiums rose 3.9%, driven by nuclear litigation verdicts and commercial insurance market hardening.
- Tires & Highway Tolls ($0.093 / mi): Tire casing wear accounted for $0.050/mile, while highway and bridge tolls added $0.043/mile (up 13.2%).
The 7 Omitted Costs That Ruin New Motor Carrier Authorities
New motor carriers rarely fail because they cannot operate a truck; they fail because they price freight using an incomplete cost model. Underpricing spot market loads stems directly from omitting real cash and capital liabilities.
- 1. Unpaid Origin and Repositioning Deadhead: Running 15% empty miles means an apparent $2.50 loaded rate is actually a $2.12 all-mile rate across your total trip distance.
- 2. Fair Market Driver Compensation: Treating owner pay as "whatever happens to be left in the bank at month-end" is the single most common reason operators fail to price freight sustainably.
- 3. Major Mechanical Overhaul Escrow: Omitting a dedicated 15 to 20 cent per-mile escrow leaves the operator defenseless when a $25,000 engine overhaul or $10,000 transmission replacement occurs.
- 4. Tire Casing Replacement Reserves: A full set of 8 virgin drive tires and 2 steer tires costs $5,000 to $6,500, requiring at least 5 cents per mile in dedicated wear reserves.
- 5. Uncompensated Detention & Wait Time: Averaging 2.5 unpaid hours at loading docks per trip burns fuel, reduces weekly billable hours of service, and increases fixed cost per mile.
- 6. State Weight-Distance & Highway Taxes: Specific corridor taxes (including New York Highway Use Tax (NY HUT), Kentucky KYU, Oregon Weight-Mile, and New Mexico Weight-Distance) add direct per-mile operating expenses.
- 7. Factoring & Cash Flow Fees: Utilizing invoice factoring (2%–3.5%) or broker quick-pay (1.5%–3.0%) reduces net collected linehaul revenue on every factored load.
Cash-Flow CPM vs. Accounting CPM: Equipment Debt and Depreciation
One of the most dangerous accounting mistakes an owner-operator can make is calculating cost per mile solely from standard Profit & Loss (P&L) statements generated by traditional accounting software.
- The Accounting P&L Omission: Standard P&L statements record equipment loan interest as an operating expense, but legally omit equipment loan principal payments (classifying principal as a balance-sheet balance reduction).
- The Cash-Flow Reality: Your equipment lender demands both principal AND interest every month (e.g., $2,500 total note). If your cost per mile calculation only includes the $400 interest portion, your cash flow will experience a $2,100 monthly shortfall.
- Solvency Rule: Always calculate Cost per Mile using your full equipment debt service (principal plus interest) to ensure your rate floor generates sufficient cash to pay monthly bank notes.
5 Tactical Rules to Lower Your Trucking Cost per Mile
In a competitive freight market where spot rates are compressed, increasing net business profit depends directly on your ability to reduce your cost per mile without compromising safety or equipment reliability.
- Rule 1: Manage Speed and Progressive Shifting: Governing road speed from 70 mph down to 63–65 mph improves tractor fuel economy from 6.0 to 6.8 MPG, saving $7,000 to $10,000 annually per 100,000 miles.
- Rule 2: Implement Tire Pressure Monitoring (TPMS): Under-inflated drive and trailer tires increase rolling resistance and accelerate tread wear. Maintaining proper inflation pressure saves 1% to 2% in fuel spend and extends casing life by 25,000 miles.
- Rule 3: Enforce Scheduled Fluid Spectrochemical Analysis: Submitting oil samples to a laboratory every 15,000 miles costs $30 but detects bearing copper wear and coolant leaks thousands of miles before catastrophic engine seizure.
- Rule 4: Shop Commercial Insurance Annually: Work with an independent commercial transportation broker to solicit competing quotes 60 days before policy renewal, maintaining clean CDL MVR records and dashcam telematics to qualify for underwriting discounts.
- Rule 5: Minimize Deadhead Through Triangle Routing: Eliminate cheap out-and-back runs by booking three-legged triangular routes that connect high-volume industrial freight centers, keeping deadhead below 10% of total miles.
How to Use Your Cost per Mile Floor on Spot Load Boards
When scanning loads on DAT One or Truckstop, calculate the all-in rate before contacting the broker: take the offered gross rate and divide by the total trip distance (empty miles to shipper + loaded miles + anticipated deadhead to the next viable freight market). If that number fails to exceed your cost per mile by your target profit margin (typically 30 to 50 cents per mile), decline the load or negotiate higher linehaul compensation.
- All-In RPM Calculation: Off-the-board spot offers must be evaluated using: All-In Rate per Mile = Total Gross Offer ÷ (Deadhead Miles to Shipper + Loaded Miles + Relocation Miles to Next Freight Hub).
- Walkaway Discipline: If your audited break-even floor is $2.05/mile and a broker offers $1,800 for a 750-mile trip plus 150 miles of deadhead (900 total miles = $2.00 all-in), that load guarantees a $45 out-of-pocket loss. Stand firm and decline.
The Deadhead Mile Trap: Why a $2.60/Mile Rate Can Lose Money
A broker offers $1,300 for a 500-mile loaded dry-van run ($2.60/mile loaded). The driver’s audited all-in operating cost is $2.15/mile. However, the driver must deadhead 130 miles to reach the shipper.
- Loaded Trip Revenue500 loaded miles × $2.60 = $1,300 gross pay.
- Total Operating Miles500 loaded miles + 130 deadhead miles = 630 total miles required.
- True All-In Rate per Mile$1,300 ÷ 630 total miles = $2.063 all-in rate per mile.
- Operating Cost of the Move630 total miles × $2.15 cost per mile = $1,354.50 total trip expenses.
- Net Trip Profit / Loss$1,300 revenue − $1,354.50 expenses = −$54.50 net loss.
Sources
ATRI: Operational Costs of TruckingComprehensive industry benchmarks for motor carrier marginal operating costs per mile.↗ATBS: Independent Contractor Benchmark ReportOwner-operator cost structures, net compensation, and variable expense allocations.↗U.S. Energy Information Administration: Petroleum & Diesel Fuel PricesWeekly retail on-highway diesel benchmarks used for fuel expense planning.↗Frequently asked questions
What is the average cost per mile to operate a semi truck in 2026?
According to ATRI’s operational cost studies, the industry average marginal cost to operate a Class 8 truck is approximately $2.34 per mile ($1.85/mile excluding fuel). For independent single-truck owner-operators with older equipment and higher insurance premiums, costs typically range between $2.00 and $2.50 per mile.
How much should an owner-operator set aside for maintenance per mile?
A minimum of 15 to 20 cents per mile should be deposited into a dedicated business maintenance escrow account. This covers routine oil and filter changes, DOT inspections, brake pads, and builds a $15,000 to $20,000 emergency fund for major transmission, turbo, or in-frame engine rebuilds.
What is a good profit margin per mile for an owner-operator?
A sustainable target profit margin above all operating costs (including a living driver wage) is 35 to 60 cents per mile. At 100,000 annual miles, a 45-cent net margin produces $45,000 in net business profit for capital reserves, equipment upgrades, and business expansion.
Does cost per mile include driver pay?
Yes. An accurate cost per mile calculation must include fair market driver compensation (typically 60 to 75 cents per mile). Treating owner pay as whatever happens to be left over at the end of the month is the primary reason operators underprice freight and fail to build sustainable businesses.